Texas
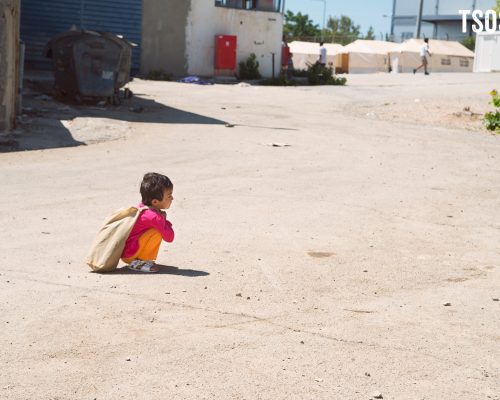
Texas has played a significant role in the resettlement of refugees, consistently ranking among the top states for refugee arrivals. However, due to its proximity to the U.S.-Mexico boarder, the state's stance on asylum seekers has been the subject of much political debate. The Community Programs team in Texas is actively engaged with local nonprofit organizations, serving in the community, and developing opportunities for collecting and sharing refugee stories.
Demographics
ARRIVALS
FY 2018-2022 data source: TRAC Immigration.
TOP COUNTRIES OF ORIGIN
FY 2022 data source: American Immigration Council: Immigrants in Texas.
Story Gallery
Explore the stories of the people who call Texas home.

Cristina Mazariego · Guatemala
A Single Mom’s Journey to Freedom

Aline Irafasha · Democratic Republic of the Congo
The Process of a Healing Journey
Unaccompanied Minors
Blog Posts
Learn more about our work and our team.
Events
Join us at an upcoming local or virtual event.
We're building our calendar of upcoming events. Check back soon or subscribe to our email list for updates.
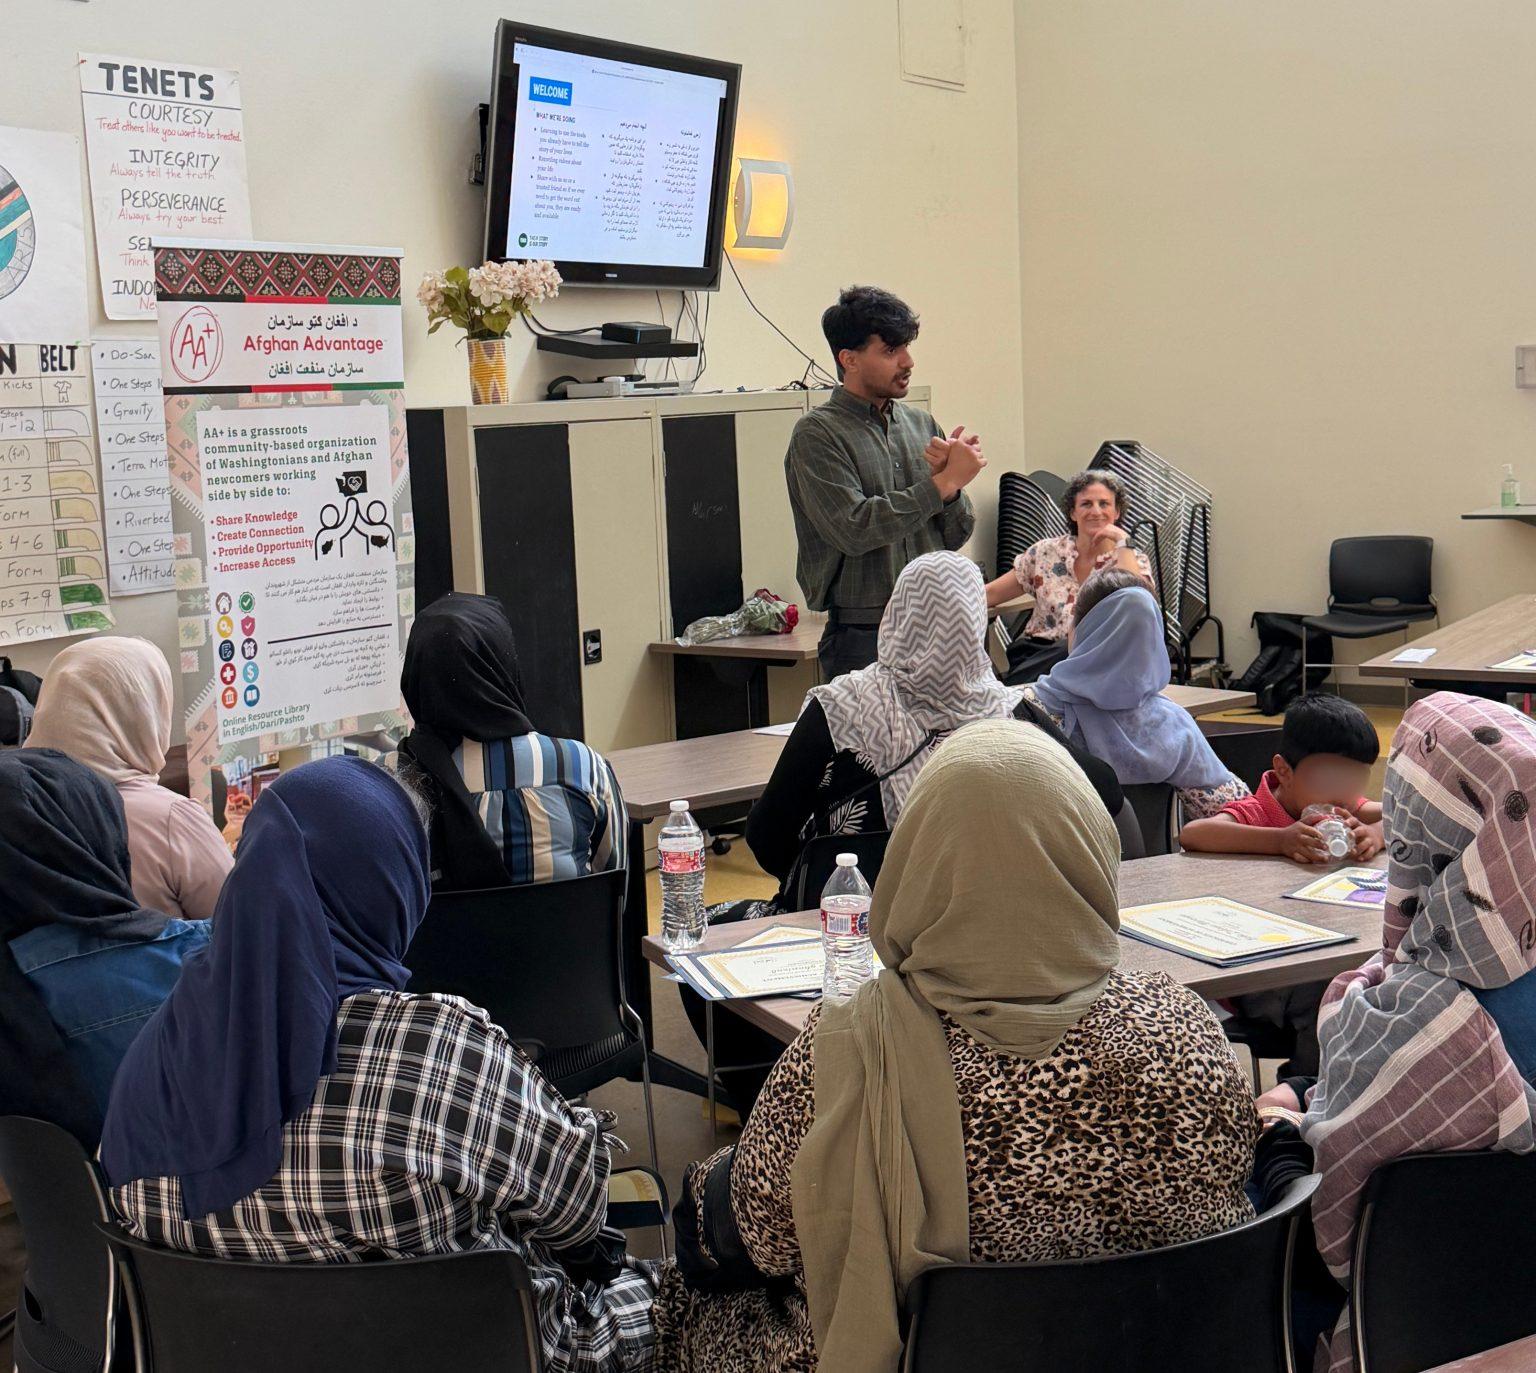
Partners
Volunteer alongside our team with these local organizations.
Leadership
Get to know our Texas leadership team.

Community Programs Coordinator, Texas

Community Liaison
Contact Us
Reach out to our local team with any questions. We love to connect with people interested in welcoming newcomers to our community.