By the end of 2024, more than 123.2 million people worldwide had been forcibly displaced from their homes due to war, persecution, or human rights abuses.
An increase of 7.2 million over 2023, that’s more than 19,619 people every day — roughly one person every 4.4 seconds.
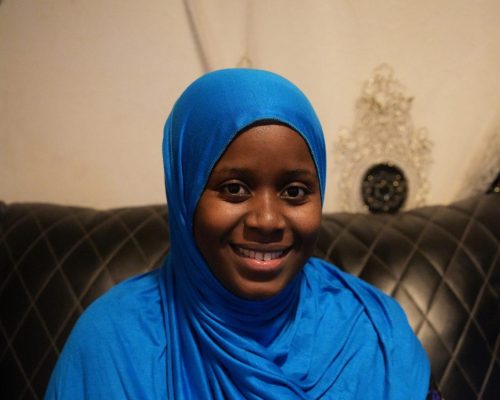
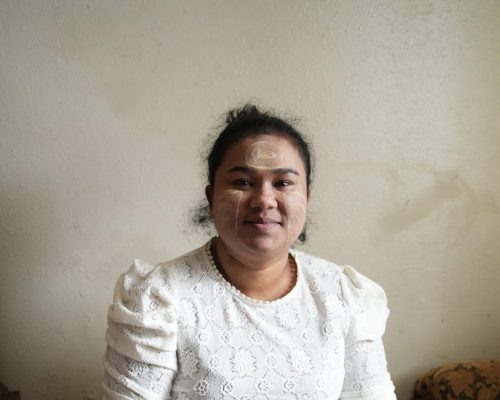
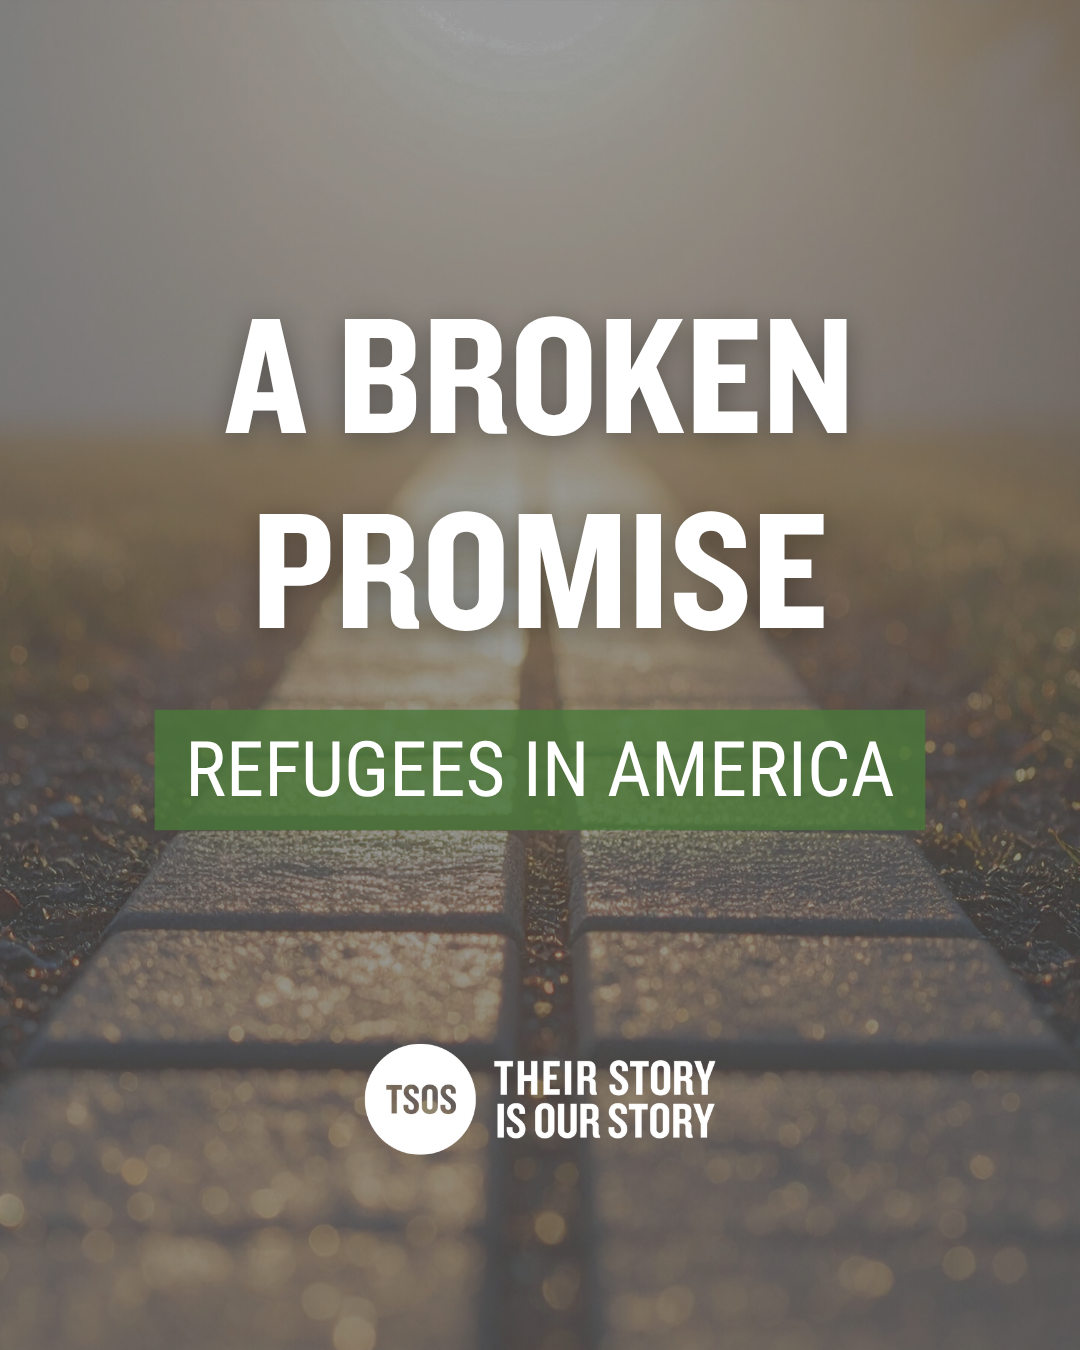
They arrive in refugee camps and other countries, like the US, seeking the one thing they’ve lost: safety.
Fleeing political imprisonment, ethnic violence, religious persecution, gang threats, or war crimes, they come with what little they managed to carry:
Legal papers – if they’re lucky.
A single backpack.
Sometimes a child’s hand in theirs.
They also carry the weight of what they left behind: fractured families, homes they’ll never return to, professions they loved, friends and relatives they may never see again.
They carry loss most of us can’t imagine – but also the truth of what they’ve endured.
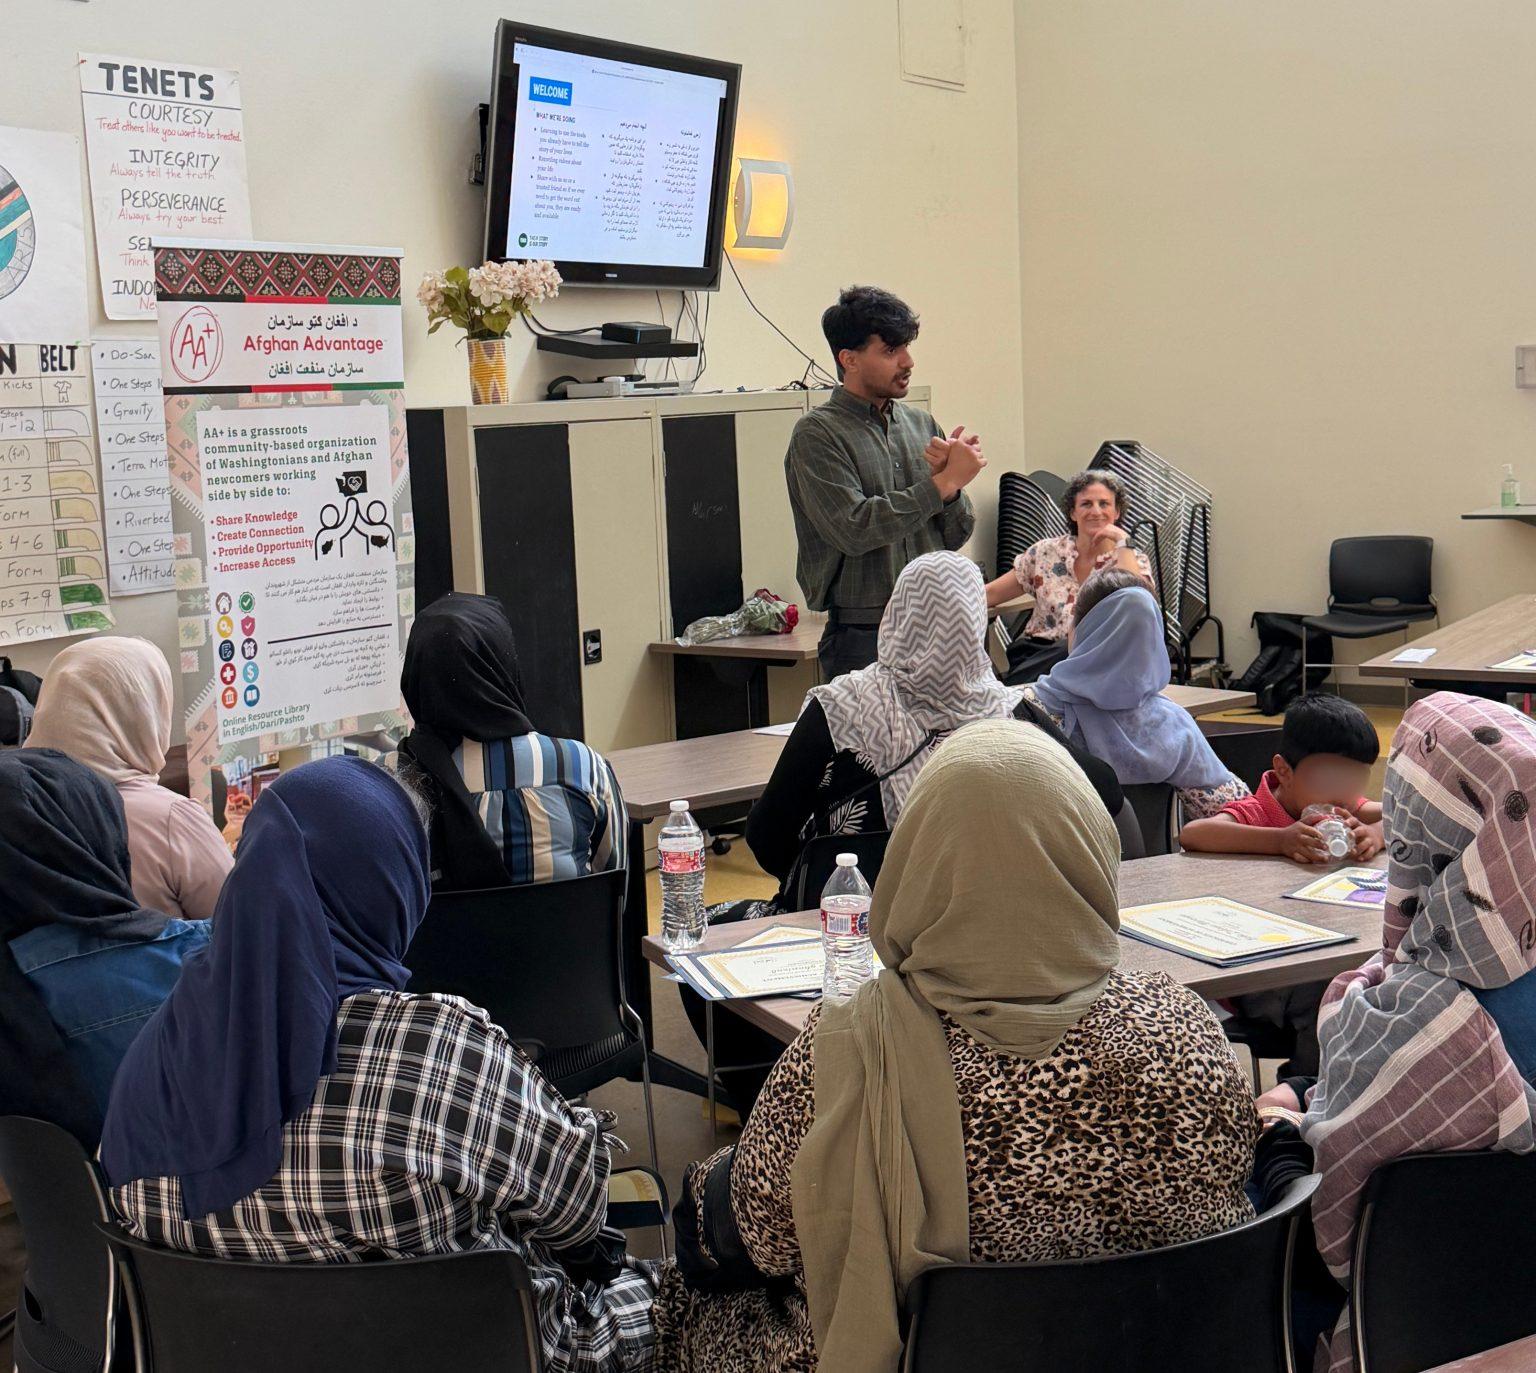
At TSOS, we believe stories are a form of justice. When someone shares their experience of forced displacement, they reclaim their voice. And when we amplify that voice – through film, photography, writing, and advocacy – the world listens. Hearts soften. Communities open. Policy begins to shift.
That shift matters. Because when neighbors understand instead of fear…
when lawmakers see people, not politics…
when a teacher knows what her student has survived…
Rebuilding life from the ashes becomes possible.
We’re fighting an uphill battle. In today’s political climate, refugee stories are often twisted or ignored. They’re reduced to statistics, portrayed as national threats, or used to score political points.
The truth – the human, nuanced truth – gets lost, and when it does, we lose compassion.
We are here to share their truth anyway.
At TSOS, we don’t answer to headlines or algorithms. We are guided by a simple conviction: every person deserves to be seen, heard, and welcomed.
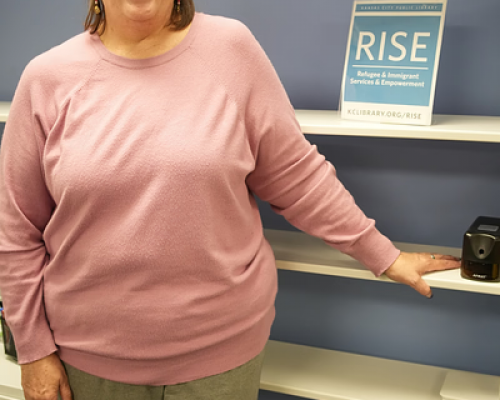
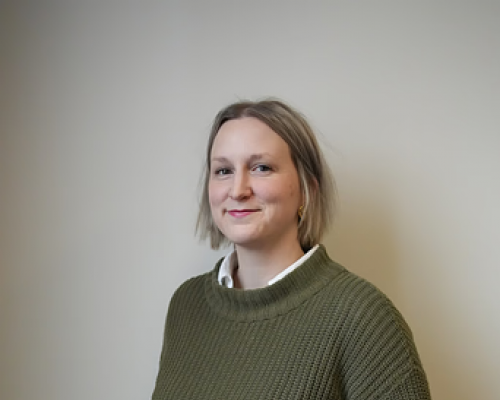
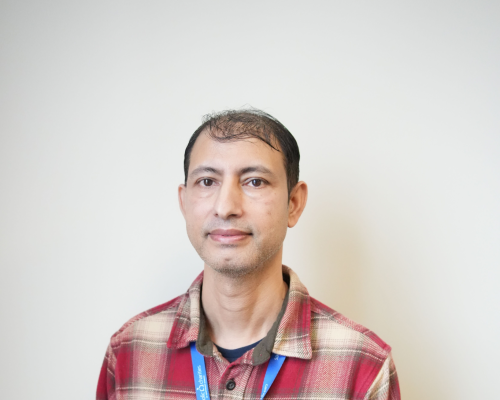
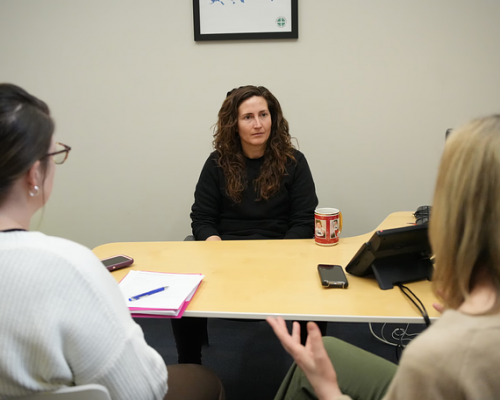
Our work is powered by the people we meet — refugees and asylum seekers rebuilding after loss, allies offering sanctuary, and communities daring to extend belonging.
Your support helps us share their stories — and ensure they’re heard where they matter most.
“What ultimately persuaded the judge wasn’t a legal argument. It was her story.”
— Kristen Smith Dayley, Executive Director, TSOS